Meet Sculptor
Hey, GTM Engineers!
Ever stare at a Clay Table knowing there’s gold inside, but you just can’t dig fast enough?
That’s why I’m so excited about the announcement of Sculptor today at Sculpt (Clay’s first user conference).
With Clay Sculptor, you don’t just build tables—you talk to your data. Instantly analyze, fix, and enrich your sources in the flow of work. No more exporting to ChatGPT, no endless cleanup.
This week, I’ll walk through a workflow that uncovered patterns in the Forbes Cloud 100 list. And yes, I’ll hand you the exact steps to steal for your next GTM sprint.
Before we dive in, check out the other announcements:

Okay, back to Sculptor.
Think of Sculptor as your co-pilot that helps you:
Build Clay tables with prompt
Add to existing Clay tables with a prompt
Troubleshoot & fix issues if they occur
Analyze data within Clay tables
The touted primary use case is to help accelerate the users’ table building journey.
However, I’d argue that the killer starting use case is actually data analysis.
Here’s a couple of data analysis examples with Sculptor:
RevOps: Analyze your best Closed Won deals to find commonalities.
Sales: Ask Sculptor to prioritize the top X accounts based on certain criteria.
Sales: Ask Scultpor for specific statistics that you want to include in QBRs.
Marketing: Did our scoring methodology correlate to conversions or should it be adjusted?
Sales Enablement: Import Gong transcripts and analyze calls reps or deals.
Venture Capital: Analyze a list of startups to find hidden trends (what I’ll show you in this post)
Basically any data set you’d download and then upload to ChatGPT for analysis — you can now do within a Clay table.
This week’s workflow will analyze the Forbes’ Cloud 100 List to figure out if there are any correlations between valuation and types of AI provided by each company.
Happy Building!
🎯 Objectives:
Upload the Forbes Cloud 100
Enrich companies & use Claygent to analyze AI capabilities
Use Sculptor to add to the table
Use Sculptor to ask questions &
⚙️ GEAR Spotlight: Sculptor
Table Builder

Use Sculptor to build tables for you
Data Analyst

Use Sculptor to ask
📹 Sculptor Demo of the Workflow
➡ The Workflow
🪜 The Step by Step
Step 1: Download the Forbes Cloud 100 list + upload to Clay
Bessemer Venture Partners & Salesforce Ventures put together this list every year to highlight the fastest growing, most valuable private companies. Clay was included in the list! What’s also crazy is that Clay has almost all of the top 10 companies as customers and a large portion of the entire 100.

Top 10 on Forbes Cloud 100
Step 2: Add Claygent Columns / Prompts for company analysis
Add various enrichments you’d like to include in your analysis.
If you want to do what I did, then use this prompt that analyzes a company’s documentation, blog posts, etc. to figure out what types of AI the company provides:
Utility AI (autocomplete, recommendations)
Assistive AI (copilot, summarizer, forecaster)
Autonomous AI (agents, auto-execution)
Platform AI (infrastructure, APIs, orchestration)
Analytical AI (forecasting, BI, anomaly detection)
Generative/Creative AI (text, code, media creation)
Embedded/Ambient AI (background optimization, personalization, ops)
Specialized/Vertical AI (domain-specific: healthcare, finance, law)
Governance/Trust AI (responsible AI, compliance, monitoring)
Drop this prompt into Claygent (it will do the first 5) + generate JSON:
#CONTEXT#

You are a Go-To-Market strategist analyzing how a company uses AI. Given a domain, review publicly available sources to analyze the product and categorize its AI capabilities.


#OBJECTIVE#

Research  and produce an AI Usage Map —  classifying the company’s AI across the five categories with Yes/No and concise justifications.


#INSTRUCTIONS#

1. Sources to use (public only):

   - Website (product pages, AI feature pages, vertical pages)

   - Blog posts, press releases, announcements

   - Case studies and customer stories

   - Whitepapers and solution briefs

   - Developer docs and API references

   - GitHub repositories (if public)

   - Trust/compliance/security pages

   - Earnings calls, 10-Ks, investor decks (if public)

   - Analyst reports (Gartner, Forrester, IDC, etc.)

   - Customer reviews (G2, Capterra, TrustRadius)

2. Starting point:

   - Visit the root domain at   From there, navigate to relevant sections listed above.

3. Evidence collection:

   - Extract exact feature names, product pages, and quotes that reference AI usage. Prefer first-party documentation; use third-party sources when first-party is insufficient.

   - Save the specific URLs used for each conclusion.

4. Classification criteria:

   - Utility AI: autocomplete, recommendations, smart suggestions embedded in UI.

   - Assistive AI: copilots, summarizers, predictors, forecasters aiding user tasks.

   - Autonomous AI: agents, multi-step auto-execution, hands-off workflow automation.

   - Platform AI: APIs/SDKs, infrastructure, orchestration layers enabling AI building.

   - Analytical AI: BI, anomaly detection, forecasting, risk scoring/analytics.

5. Decision rules:

   - Mark a category “Yes” only if there is clear, explicit evidence from sources. Otherwise “No”.

   - When ambiguous, default to “No” and explain the uncertainty in the summary.

6. Output formatting:

   - Title: AI Usage Map —

   - For each category, output: Category → Yes/No. 2-sentence summary referencing concrete features and include one source URL in parentheses at the end.

7. Quality checks:

   - Verify company identity via the site branding on . If the domain appears unrelated to , note the mismatch and proceed cautiously or return “No evidence found”.

   - Avoid paywalled/authenticated content. Use only accessible pages.

   - Do not infer capabilities beyond what is documented.


#EXAMPLES#

Example Output:

AI Usage Map — Acme Corp

Utility AI → Yes. The product includes in-app autocomplete for queries and personalized recommendations on the dashboard (https://acme.com/product).

Assistive AI → No. No credible references to copilots or summarization assistants were found across docs or blog (https://acme.com/blog).

Autonomous AI → Yes. Workflow agent triggers multi-step actions after anomaly detection with minimal user input (https://acme.com/solutions/automation).

Platform AI → No. There are no public AI APIs/SDKs or orchestration features documented (https://acme.com/developers).

Analytical AI → Yes. The analytics suite offers anomaly detection and risk scoring embedded in BI dashboards (https://acme.com/analytics).
Step 3: Start asking questions about the data

📌 GTM Engineering Jobs @ The Fastest Growing Companies
1. Vapi | 1 Yr. Growth : 511.76% | Valuation: $130M | GTM Solutions Engineer
2. AirOps | Growth: 250% | GTM Engineer
3. Rollstack | 1 Yr. Growth: 120% | GTM Engineer
4. OpenAI | 1 Yr. Growth: 117.87% | Valuation: $300B | Analytics Engineer, GTM
5. Pump.co | 1 Yr. Growth: 106% | GTM Engineer (Clay Experience)
6. Stedi | 1 Yr. Growth: 89.74% | Valuation: $200M | GTM Engineer
7. Tailscale | 1 Yr. Growth: 61.65% | Valuation: $1.4B | AI GTM Engineer
8. Atlan | 1 Yr. Growth: 55.33% | Valuation: $750M | GTM Engineer
9. Basis Theory | 1 Yr. Growth: 39.28% | Senior GTM Engineer
📖 GTM Engineering Resource of the Week
Sharon Roessen, COO of Terrapinn, provides a really nice overview of how to use Clay for B2B events.
👀 What I’m Reading
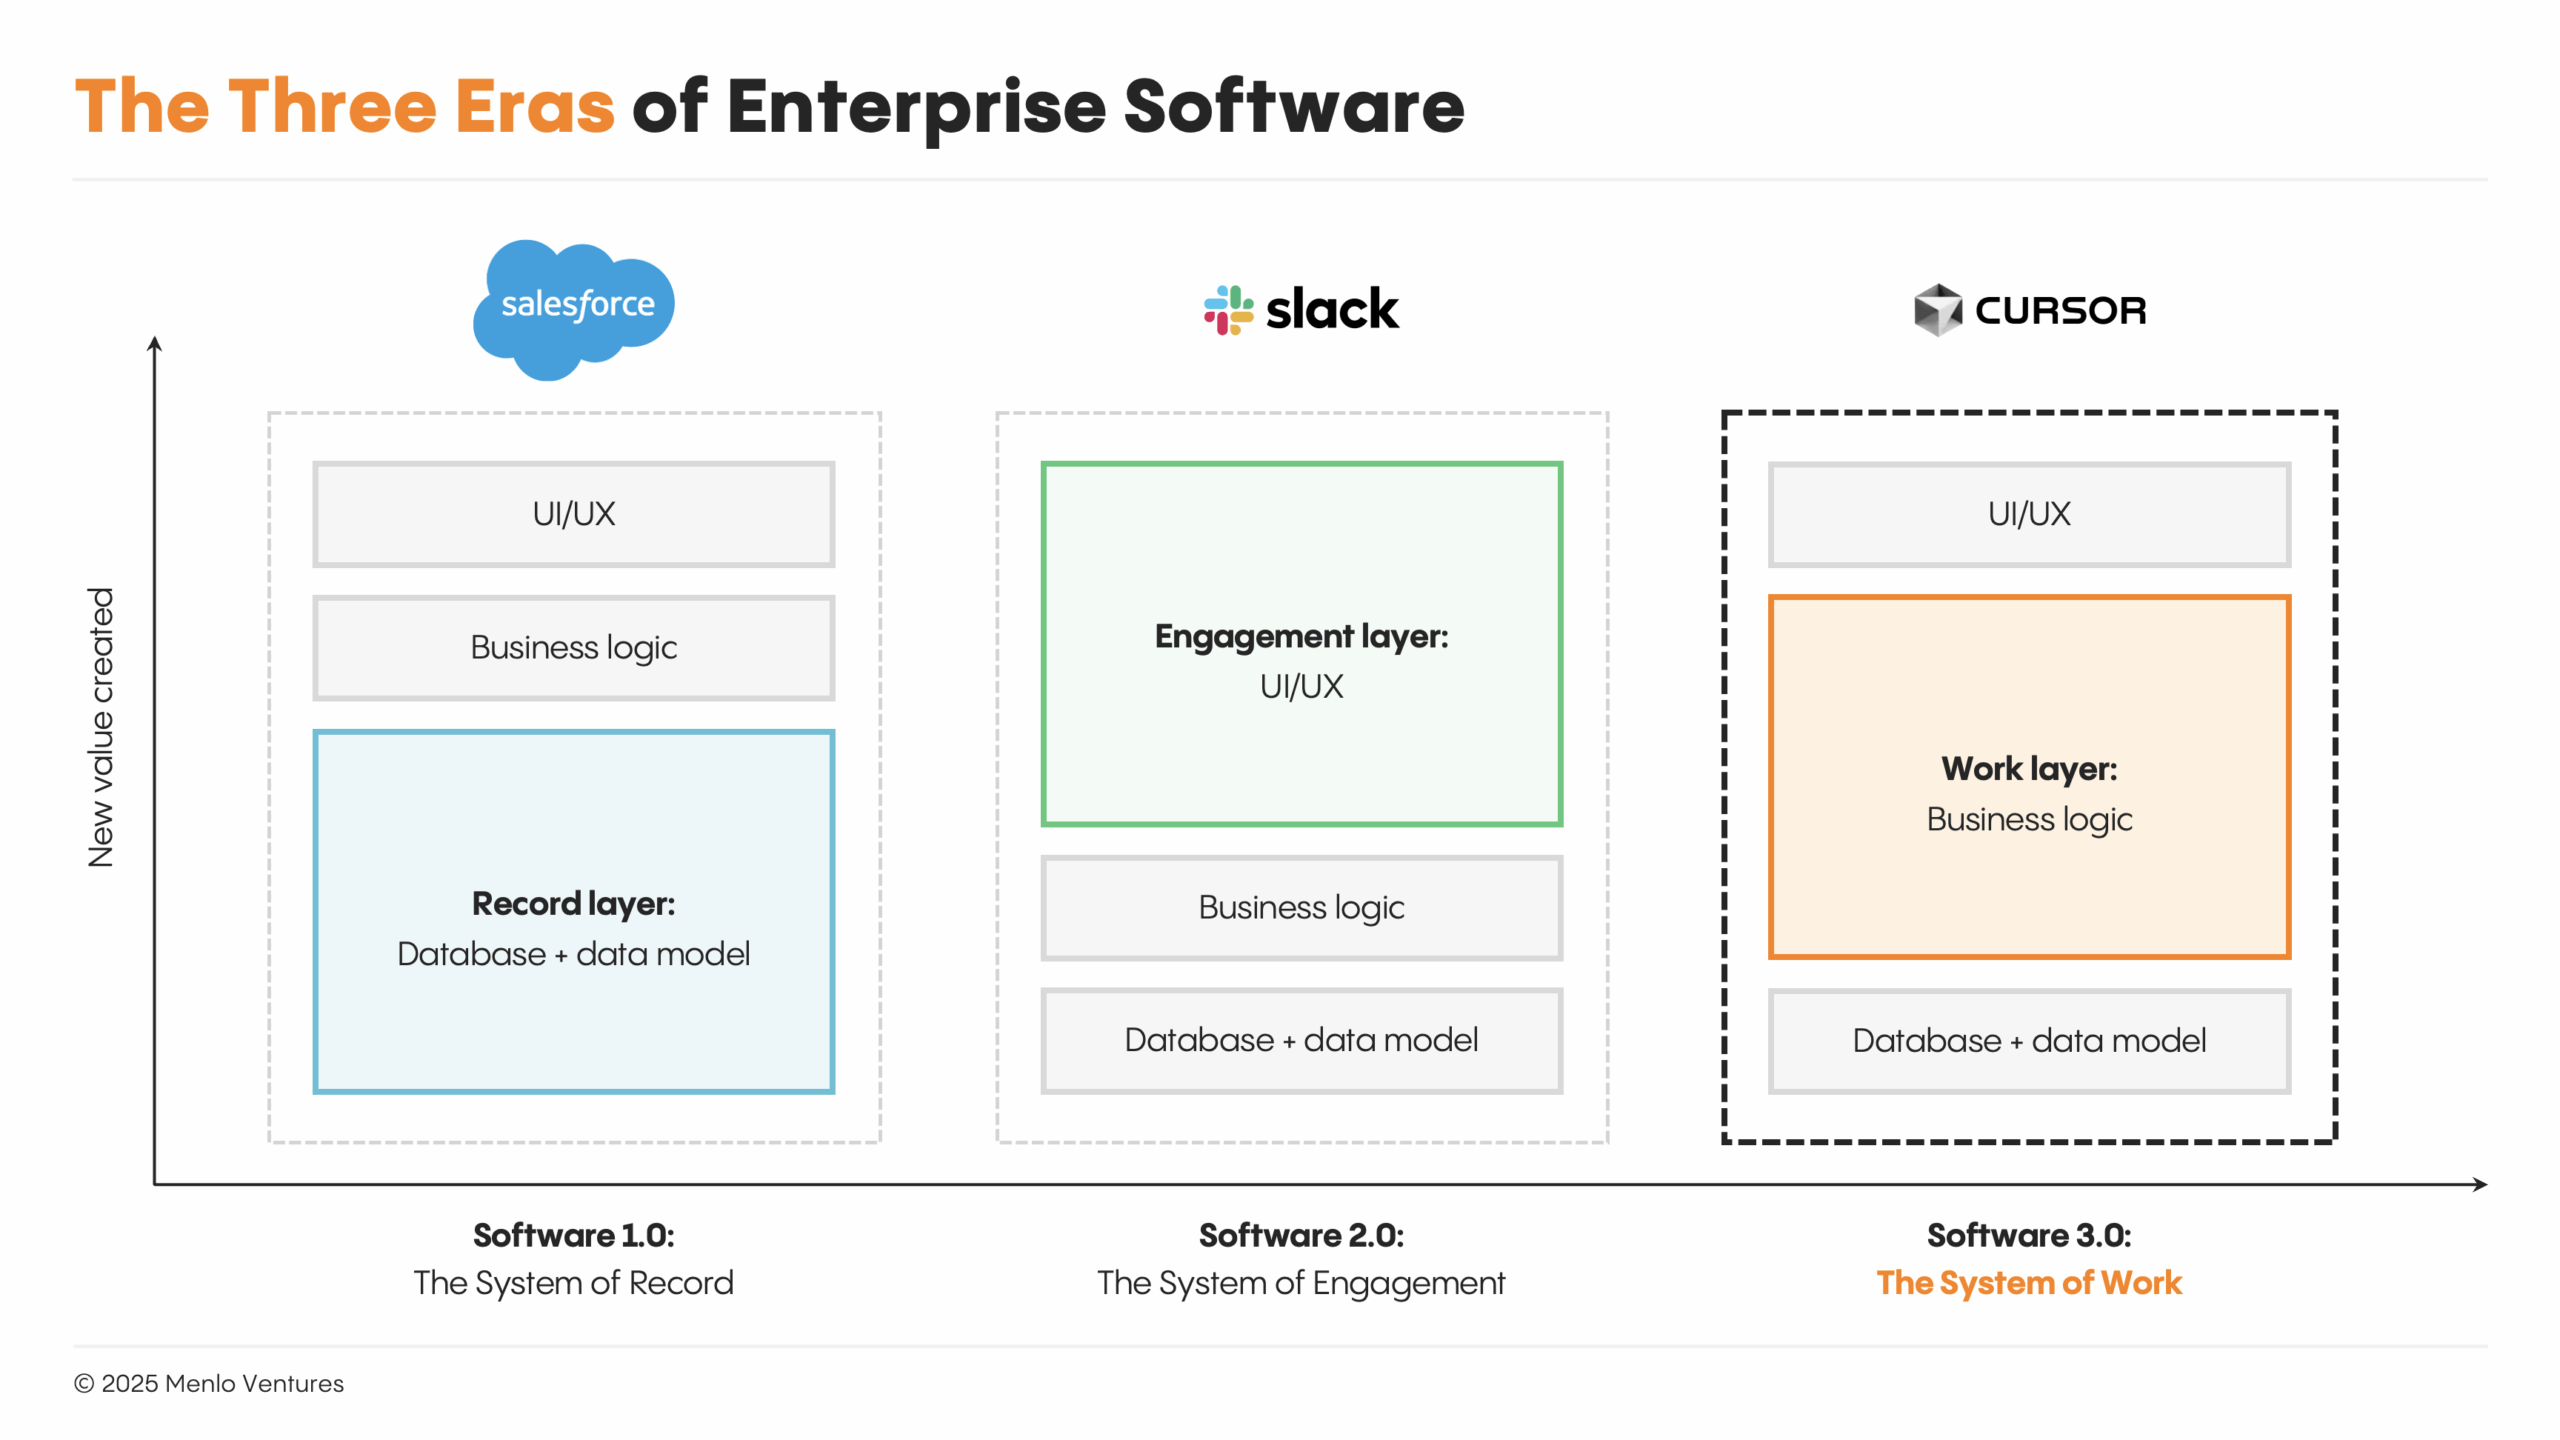
The future of @clay_gtm in one picture. Except Clay = the system of action, connected to and orchestrating everything: Databases, APIs, LLMs, MCPs, CRMs, GTM tooling,
— #Claymation.io (#@gtm_engineering)
12:01 AM • Sep 10, 2025


